 |
| World's Population Growth |
The Human resources like other forms of resources are not evenly distributed in the world. The age, number, sex and education level also change the characterstics of human resources.
Several countries have identified the value of human resources and they have come up with special department for their development. The Government of India also has a Ministry of Human Resource Development. It was established in 1985 with sole aim to develop the human resources of the country.
Distribution of Population
- The way in which people are distributed all over the world is known as population distribution pattern.
- The population distribution is very uneven. More than 90 per cent of world population lives on 30 per cent of the land.
- South and Southeast Asia, Europe and North-eastern part of North America are some of densely populated regions in the world.
- Almost three quarter of world population lives in Asia and Africa.
- Most people live in tropical area than polar regions.
- 60 per cent of people live in only 10 countries.
- China and India combinedly counts for one in three people around the world. China is the most populated country in the world followed by India.
Population Density
- Population density can be defined as the number of people living in a unit area of land.
- It is normally expressed as in as per square km.
- The average world population density is 51 person per square km. The average population density of India is 382 person per square km.
- South Central Asia is the most densely populated region in the world followed by East Asia and South East Asia.
Factors Affecting Population Distribution
Geographical Factors
- Topography: People prefer plains rather than mountains and plateaus as they are suitable for agriculture, industries and service sector. The Ganga-Brahmaputra plain is one most of populated areas in the world whereas Himalayas region is one of sparsely populated areas.
- Climate: People prefer nice and warm climate. They avoid extreme climatic zones such as desert and polar regions.
- Soil: We are largely dependent on production of food for our survival. People search for fertile soil region for same purpose. This is why we can rise of river civilizations throughout the world such as Indus, Nile and Hwang-He.
- Water: Availability of fresh and clean water is must for both human and agricultural needs.
- Minerals: Mineral-deposited areas are also heavily populated regions in the world. Discovery of daimonds in Johannesburg and Oil in Middle East led to settlements of population in these areas.
Social and Economic Facts
- Social: Areas with better housing, transport and health facilities attract more people. Examples: Pune and Chandigarh.
- Cultural: Places with religious significance attract a lot of people. Examples: Varanasi, Haridwar, Jerusalem, Mecca and Vatican City.
- Economics: Places with large employment opportunities attract people. Example: New York, London, Mumbai and Osaka.
Population Change
- The population change refers to the change in number of population over the years.
- The world population has rapidly increased since 1800. In 1804, the world poulation reached 1 billion mark. In 1959, it reached 3 billion mark. In 1999, it doubled and crossed 6 million mark. As of now, there are 7.7 billion people in the world.
- This change can be attributed to better health facilities, sufficient food, access to clean water and rise in standard of living.
- The change in population depends upon three factors: Birth Rate, Death Rate and Migration.
- Birth Rate refers to number of new borns per 1000 people. Death rate refers to the number of deaths per 1000 people. Migration is the movement of people in and out of the region.
- Birth rate and death rate are natural causes of the population growth. The difference between birth rate and death rate is known as natural growth rate.
- Migration is the human factor. People who leave their home country are known as emigrants and people who settle in new countries are known immigrants.
- Countries like Australia, Canada and United States have gained human resources by immigration (in-migration) and Countries like Sudan has lost human resources due to emigration (out-migration).
- The general trend of migration is from the less developed countries to developed countries and within a region or country, from rural areas to urban centres. People generally migrate in search of better work opportunities.
Patterns of Population Change
- Although, world population is rising, but not all countries are experiencing same growth.
- As of now, most African nations are seeking in rise of population whereas population growth has stagnated in developed nations such United Kingdom and Japan.
 |
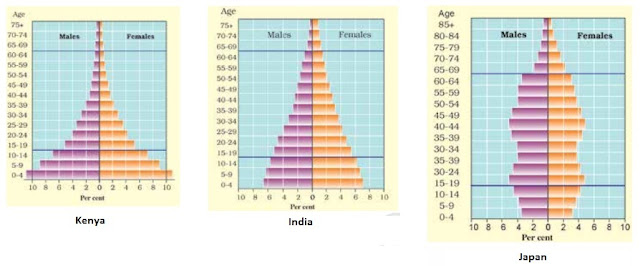
| Population Pyramid of Kenya, India and Japan |
- The population composition refers to the structure of the population. It is based on the factors such as educational level, age, sex, health, occupation and income levels.
- It helps us to identify focus groups and their requirements. It is done with the help of population pyramids. Age-sex pyramid is a typical example of population pyramind.
- In age-sex pyramid, we divide population into different age groups such as 0-5, 5-9, 9-14 and so on. Further, we subdivide it into two sub groups, male and female.
- The age-sex pyramid helps us to identify dependent and working population. People aged between 15-65 are counted as working population while population in 0-15 is identified as young dependent and above 65 as elderly dependent.
- Countries such as Kenya where birth and death rates high have broad base and it rapidly narrows toward the top.
- Countries such as India where infant death rates are decreasing have broader base.
- Countries such as Japan where both low birth rates and decreased death rates have lower base and larger division in above 65 mark.
